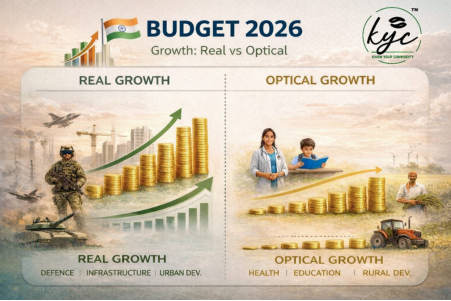
Ministry-wise Allocations (Revenue + Capital, All figures in ₹ crore, BE 2026–27 unless stated 📊 otherwise.) Ministry of Health & Family Welfare🏥 Revenue Expenditure: ~₹1,01,784 crore Capital Expenditure: ₹2,815 crore Medical & Public Health (Capital): ₹2,815 crore Family Welfare (Capital): ₹7 crore Total Health Outlay: ~₹1,04,599 crore Capital focus is on medical infrastructure, trauma care centres, and institutional capacity 📌 expansion. Total Health Outlay YoY Growth: ~+1.7% Ministry of Education🎓 Revenue Expenditure: ~₹1,39,079 crore Capital Expenditure: ₹211 crore Education, Sports, Art & Culture (Capital): ₹210.6 crore Total Education Outlay: ~₹1,39,289 crore Education remains overwhelmingly revenue-driven (teachers, institutions, schemes), with 📌 limited asset creation. Total Education Outlay YoY Growth: +0.3% Ministry of Defence🛡️ Revenue Expenditure: ~₹3,65,479 crore Capital Expenditure: ₹2,29,106 crore
Total Defence Outlay: ₹5,94,585 crore Capital spending continues to anchor modernization, domestic procurement, and strategic 📌 capability build-up. Total Defence Outlay YoY Growth: ~0% (re-balancing within envelope) Ministry of Agriculture & Farmers Welfare🌾 (Includes Agriculture & Allied Activities) Revenue Expenditure: ~₹1,61,394 crore Capital Expenditure: ₹277 crore Crop Husbandry, Fisheries, Forestry, Warehousing, etc. Total Agriculture Outlay: ₹1,62,671 crore Agriculture remains revenue-heavy, with minimal capital formation relative to sectoral 📌 importance. Total Agriculture Outlay YoY Growth: ~+0.1% Ministry of Rural Development🚜 Revenue Expenditure: ~₹2,72,227 crore Capital Expenditure: ₹0.9 crore Total Rural Development Outlay: ₹2,73,108 crore Almost entirely revenue-led via MGNREGA, housing support, and transfers.📌 Total Rural Development Outlay YoY Growth: +0.4% Ministry of Housing & Urban Affairs🏙️ Revenue Expenditure: ~₹81,394 crore Capital Expenditure: ₹4,128 crore Total Urban Development Outlay: ₹85,522 crore Capital spending reflects metro projects, urban transport, and housing infrastructure.📌 Total Urban Development Outlay YoY Growth: +0.7% Ministry of Power / Energy⚡ Revenue Expenditure: ~₹1,08,293 crore Capital Expenditure: ₹736 crore Total Energy Outlay: ₹1,09,029 crore Capex moderation reflects completion of earlier large thermal and petroleum investments.📌 Total Energy Outlay YoY Growth: +1.2% Big Picture Takeaway🔍 Defence and Infrastructure-heavy ministries dominate capital expenditure. Agriculture, Health, Education, and Rural Development remain revenue-centric, indicating: High dependence on subsidies, salaries, and transfers Limited long-term asset creation at the sector level The capex intensity gap between physical infrastructure and human/agri sectors remains structurally large.